Tracking Data Studio Report Usage via Google Analytics

Did you know you can track your clients data studio report usage via Google Analytics?

Trackify recommend setting this up to see who is and isn’t using all those lovely dashboards you’ve set up!

To add tracking to your reports, follow the following steps:

Step 1

For this tracking we recommend setting up a new Google Analytics Account so you don’t risk skewing any existing data. Setup a new Google Analytics account here. We recommend excluding your personal IP address if you are responsible for building the dashboards. You can find out how to do this here.

Trackify recommend making the account name something recognisable such as ‘Data Studio Tracking’ and the website URL ‘https://datastudio.google.com’ as below:

Screen Shot 2018-10-31 at 3.38.34 PM.png

Step 2

Once your account has been created - make a note of your property ID under Property Settings.

Then go over to your Data Studio report in ‘Edit’ Mode and click File > Report Settings

Screen Shot 2018-10-31 at 3.41.57 PM.png

Enter your noted Property ID under ‘Google Analytics Tracking ID’

Screen Shot 2018-10-31 at 3.43.40 PM.png

Click out of settings and this change will be saved.

Step 3

Test your setup by changing to ‘View’ mode in your Data Studio Report and watching your data filter through into Google Analytics Real Time Reports. If you’ve already excluded your IP address this won’t work but you can still test using Google Tag Assistant.

Screen Shot 2018-10-31 at 3.52.45 PM.png

Step 4

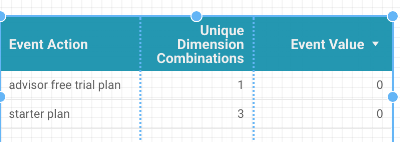
As you can see above, the report URL is coming through as the page URL and the Report Name & Page Name is the Page Title.

I recommend having a standardised naming format for all of your Data Studio reports such as:

‘Client Name’ - ‘Report Name’

E.g. Auckland Barbers - Adwords Performance Report

This way you can easily create reports and filter by client name etc.

Step 5

Optional : Create a Data Studio report to see your top used Data Studio reports.

Here’s a free template designed by Trackify for you to use:

https://datastudio.google.com/open/1rvdMhSKFQR6mWZK6NfAVXh8LWQcl5q7m

Happy Tracking!

How To Easily Set Up your Shopify and Google Analytics Enhanced Ecommerce Integration

Setting up eCommerce tracking in Google Analytics isn't always straight forward.  However, if you're using Shopify to run your online store you're in luck! 

Shopify have made it really easy for you to see your Ecommerce Data within Google Analytics but first you'll need to set it up using these 4 steps:


Step 1 - Log in to Google Analytics.

You can login in to your Google Analytics account here.  If you don't have Google Analytics set up yet you can get in touch with Trackify to help.

Step 2 - Switch On Enhanced Ecommerce Tracking within Google Analytics

1. Go to the admin settings in your Google Analytics Account by clicking on the cog icon in the bottom left hand corner:

Screenshot 2017-12-04 14.46.13.png

2. Within the settings screen - click 'Ecommerce Settings' under your Main View.  Find out about different view types here:

Screenshot 2017-12-04 14.51.08.png

3. Within the Ecommerce Settings ensure Ecommerce is set to 'ON'

Screenshot 2017-12-04 14.53.17.png

4. Also ensure Enhanced Ecommerce is set to 'ON' and click 'SUBMIT'

Screenshot 2017-12-04 14.54.02.png

5. While logged into Google Analytics, make a note or copy your tracking id that is found under admin > property > property settings:

Screenshot 2017-12-04 15.42.40.png


Step 3 - Add Google Analytics to Shopify & Enable Enhanced Ecommerce

  1. Copy the analytics tracking id from your Google Analytics account as above (admin > property > property settings)
     

  2. Open your Shopify Admin in a new browser window
     

  3. Go to Online Store > Preferences
     

  4. Under preferences, paste the analytics tracking id in the Google Analytics field
     

  5. Tick 'Use Enhanced Ecommerce'
     

  6. Click on the save button.

Step 4 - Analysing your Data using Data Studio

Once you have completed Steps 1 -3 your data will start collecting with Google Analytics.  Once you've collected a few weeks of data you'll be able to start answering the following questions:

  1. What is my eCommerce Conversion Rate?

  2. How many views/impressions are my products getting?

  3. What products are being 'added to cart'?

  4. What is my 'Cart-to-Detail' Rate? (The number of products added to a shopping cart per number of product-detail views)

  5. What sources are driving my sales and revenue?

  6. Which cities are driving my sales and revenue?

  7. What device type is driving my sales and revenue?

  8. Are my sales from new or returning visitors?

You can find this data within the eCommerce section of Google Analytics (found under 'Conversions)'.

Google Data Studio Unique Events System Error

If you're using Google Data Studio for your Google Analytics reporting, it's likely you've logged in today and seen a system error for any widgets containing the 'Unique Event' metric:

Google Analytics have renamed the 'Unique Events' metric to 'Unique Dimension Combinations'.  To add to confusion, they've deprecated the api field and also created a new metric called 'Unique Events' which is calculated differently to the previous Unique Events metric.  For more details check out this post https://www.clickinsight.ca/about/blog/unique-dimension-combinations-udc

How To Fix This Issue

To resolve this issue and get your reports working again you'll need to refresh your report data source and update the metric in your widget.

Step 1 - Refresh Your Data Source

Firstly, in edit mode, click on the widget showing the system error and click on the pencil icon next to your data source:


Then click 'Refresh Fields':

Screen Shot 2017-04-27 at 3.20.04 PM.png

Step 2 - Update Your Metric

Once the fields have been refreshed you will notice that the widget error and metric have updated as below:

Screen Shot 2017-04-27 at 3.34.21 PM.png

At this point you will need to click on 'Invalid Metric' and select 'Unique Dimension Combinations' or 'Unique Events' depending on which metric you want to use:

Screen Shot 2017-04-27 at 3.35.57 PM.png

Once you have selected your new metric your report widget should be working again:

Screen Shot 2017-04-27 at 3.38.14 PM.png

You will need to carry out the above steps for all widgets showing this error.

I've had a play around with Google Data Studio beta...and it's good!

When I heard that Google was released a visualisation tool as part of its Analytics 360 suite, I wasn't surprised given how important reporting via a dashboard is to enterprise-level organisations.  With the beta being released only recently, I was excited to get my hands dirty and have a play with it.

Given it was initially (and as of July 12, still is) only to users in the US, I had to use a VPN (*cough*) to access the beta, allowing me to create 5 custom reports.

After about an hour, I've been very impressed with the tool and whilst there's some bugs, it's to be expected (given it's in beta).  Here are some highlights:

1.  A lot of data connectors possible (esp. via Google Sheets)

THE CURRENTLY SUPPORTED "OUT OF THE BOX" CONNECTORS ARE (NOT SURPRISINGLY) ALL GOOD PRODUCTS.

Whilst the default data connectors are only Google properties, this increases exponentially with Google Sheets given the vast sources of information you can import via Supermetrics plug-in.  Having all sources (e.g. cost data) in a single dashboard will ensure that important calculated metrics such as ROI will be easily calculated.

Once the product is released (also a part of the Google 360 suite, I'll also be interested to see what Attribution 360 data can be added.  Especially if it will be used to put data from other sources in context!  I'm a big believer in always putting figures and facts in context to assess whether its "performing or not".

2.  Connecting sources a breeze!

With other dashboards, I've (almost always) had issues with connected external data sets.

The process of actually connecting data sources couldn't have been easier (disclaimer: I've only connected Google Analytics data).  This is in relation to other third-party dashboard solutions where I've found it much more cumbersome to connect data sources.  It shouldn't be surprising given the connectors are all under the Google "eco-system".

The business implication here is that it makes creating dashboards much easier for anybody.  This is only good news for those that may not have the "technical" skills that may have been needed with other solutions.

3.  Ability to customise "look & feel" of dashboards are endless

My personal philosophy with dashboarding and reports is that it (along with being meaningful, of course!) must aesthetically look appealing.  It is my experience that reports that look great have more chance to have attention spent on it by your target audience (unless your target audience are finance people / accountant - in which case, just give them tables full of figures!)

Google Data Studio not only made customising the look & feel very easy - but the options that it gives is almost endless.  This is fantastic when analysts think about dashboard layout and strategy around meaningful information to report on and how (pie chart, table, line graph etc.) this information will be represented.

Dashboards that are meaningful and look great are gold!

Dashboards that are meaningful and look great are gold!

4.  In short, Google Data Studio is very promising!

As someone that loves creating reports and dashboards (nerd alert!), I've been very impressed with Google Data Studio.  

I'm going to hold off on calling it such things as a "game changer", but only because official pricing for the product has not been released yet!  The tool itself is fantastic, but given that it's part of the 360 suite, it will be price geared towards enterprise (i.e. cha ching!!! i.e. not cheap).  However, as a beta, it is certainly warranting itself as a tool that will justify a premium.

What do you think?  Have you had experience with Google Data Studio?  I'd love to hear of your experience and your thoughts!